Medical Spa SEO Benchmarks: What We Learned From 101 Top Medspas in 35 U.S. Cities

105 businesses. 101 websites crawled. 32,742 pages mapped. 248 interior pages read. Here is what actually brings patients in and what the medspa marketing industry sells instead.
438
monthly visits for the typical top-ranked medspa
27
of 101 get under 100 visits a month
32,742
pages mapped across the whole category
78%
of reviews name a specific staff member
Here is a number worth sitting with before you read anything else.
We searched med spa plus a city name in the 35 largest aesthetic markets in the United States and wrote down the first three medical spa websites Google returned organically in each one. New York, Los Angeles, Chicago, Houston, Dallas, Miami and twenty-nine more. These are the businesses winning the search every medspa owner in America asks their marketing company about.
Twenty-seven of those 105 businesses get fewer than 100 visits a month from Google. Seventy-one of them get fewer than 1,000.
For a business where one Morpheus8 package is $2,400 and a year of injectables is $4,000, four hundred visits a month is not a marketing programme. It is a rounding error with a logo on it.
Most of these medspas are paying somebody between $1,500 and $6,000 a month to fix this. Based on what we found in the data, most of them are being sold the wrong thing entirely.
So we measured it ourselves. Ahrefs data on all 101 sites, then our own crawl of every homepage, every sitemap, and 248 interior pages. One question of every measurement:
Does this actually separate the medspas that get found from the medspas that don't?
Some of it matches what good marketers already do. A lot of it contradicts what agencies in this category sell every day.
The Short Version

Where These Numbers Come From
Every number in this article comes from one of three collection steps, all run in the last week of August 2026.
Step | What we did | Result |
Search results | Ran the exact query med spa {city} in 35 US cities. Organic web results only. Directories, social profiles and non-medspa providers excluded. | 105 businesses, 3 per city |
Search metrics | Ahrefs batch analysis on every root domain, scoped to domain-with-all-subdomains. | 101 unique websites, 35 metrics each |
Our own crawl | Fetched all 101 homepages and measured 60+ things: words, headings, images, tables, internal links, treatments named, pricing language, financing, booking software, schema markup, platform. | 101 of 101 homepages returned clean |
Sitemap corpus | Kept every URL from every sitemap and classified all of them into fourteen page types question, condition, comparison, cost, results, location and more. | 32,742 pages mapped |
Interior page crawl | Crawled a stratified sample of interior pages from each site one cost page, one question page, one treatment page, one condition page and measured depth, tables, pricing and internal links. | 248 pages across 86 sites |
Live search check | Checked who currently ranks for the local cost query in three markets against who ranks for the category term. | 3 markets spot-checked |

What we could not measure
Google Business Profile. Map-pack rank, call volume and direction requests cannot be pulled at scale for 101 businesses. This study measures organic web results only. For a medspa, the map pack matters enormously - this is a boundary of the method, and you should read every finding here as being about the website, not the whole marketing picture.
Two multi-location chains. VIO Med Spa ranks in four of our cities and Elase in two, but Ahrefs reports their traffic at national domain level. Both are excluded from every city-level benchmark in this article and flagged wherever they appear.
Sitemap counts are declarations, not indexation. A site claiming 1,200 pages may have 600 in Google. We report what the site says it publishes.
101 websites is not 11.8 million search results. This is a deep look at a narrow, high-value slice, not a study of how Google works. Where a finding is thin - a category with six sites in it, we say so on the chart.
Part 1: How You Compare to Everyone Else
How Much Traffic a Page-One Medspa Actually Gets

Monthly organic visits | Number of medspas | Share of the field |
Under 100 | 27 | 27% |
100–500 | 27 | 27% |
500–1,000 | 17 | 17% |
1,000–5,000 | 22 | 22% |
5,000+ | 8 | 8% |
Where every medspa in the study sits.
A note on these numbers. They come from Ahrefs, which estimates traffic rather than counting it. For big sites the estimate is close. For small and new sites it can be far too low we found one medspa reported at 777 visits that actually gets over 3,000. So use these numbers to see who is ahead of whom, not as a headcount. Everything from Part 5 on comes from data we gathered ourselves and does not have this problem.
The typical one gets 438 visits a month. That is the median of the group Google itself has decided are the best answers in the biggest cities in the country. Ahrefs values that traffic at about $771 a month in equivalent ad spend.
If you run a medspa and you are somewhere in the two-to-eight-hundred range, this is the first useful thing this study can tell you: you are not behind. You are exactly average for a business that ranks. That is a much lower bar than anybody selling you SEO has led you to believe, and it means the gap between you and your market's leader is smaller than it feels.
The Top Medspas Get 238 Times More Visitors Than the Bottom

Quartile | Sites | Median visits/mo | Ad value/mo | Search terms | Top-3 terms | Domain Rating | Real links | Pages |
Quietest 25% | 26 | 14 | $28 | 3 | 0 | 1.6 | 71 | 97 |
Second 25% | 25 | 266 | $512 | 34 | 11 | 6.0 | 88 | 137 |
Third 25% | 25 | 775 | $1,140 | 78 | 30 | 8.0 | 112 | 225 |
Busiest 25% | 25 | 3,212 | $4,451 | 380 | 158 | 25.0 | 202 | 489 |
The four quartiles on every metric we collected.
Thirteen visits a month against 3,212. Both groups rank in the top three of a major market. Both, presumably, believe their website is working.
The ratio is extreme because the bottom of this field is genuinely close to zero, the quietest quarter has a median Domain Rating of 1.6 and ranks for three search terms. In our equivalent study of plastic surgery practices the same gap was 18x, because plastic surgery has no floor this low. Medspa does.
That Gap Is Worth $4,423 a Month in Free Advertising
Traffic is abstract. Here is the same gap in the only unit that matters to a business owner.

Quartile | Median visits/mo | Median ad value/mo | Value per visit |
Quietest 25% | 14 | $28 | $1.94 |
Second 25% | 266 | $512 | $2.01 |
Third 25% | 775 | $1,140 | $1.71 |
Busiest 25% | 3,212 | $4,451 | $1.63 |
Traffic, ad value and value per individual visit.
The busiest quartile receives $4,451 a month of search visits. The quietest receives $28. That difference is not a marketing metric, it is $53,000 a year of advertising the leader in your market does not have to pay for and you do.
And before you assume the leaders are simply buying volume with junk keywords, we checked.

The value of a single visit is essentially flat across the entire field: $1.94, $2.03, $1.67, $1.82. Nobody is inflating their numbers with worthless traffic. The leaders are getting the same quality of visitor as everyone else. They are simply getting a great many more of them.
Ten Medspas Are Taking 64% of the Traffic

Group | Share of all traffic in the study |
Top 3 websites | 33.7% |
Top 5 websites | 47.0% |
Top 10 websites | 64.4% |
Top 20 websites | 79.8% |
Bottom 50 websites | 3.9% |
How the study’s total traffic is distributed.
Three websites hold 29%. Ten hold 64%. The bottom fifty share 3.4% between them.
This is more concentrated than what we found in plastic surgery, where the top ten held 41%. The medspa category is winner-take-all to a degree that surprised us, and the reason is worth understanding: plastic surgery has a hundred practices competing on content in every major market. Medspa mostly does not. So when one operator in a city decides to publish seriously, there is nobody contesting it.
27 of Them Get Fewer Than 100 Visitors a Month

Twenty-seven under 100. Fifty-four under 500. Seventy-one under 1,000.
Every one of them is a top-three organic result in one of the largest cities in the United States. Hold that thought, we come back to it in Part 3.
What a Good Month Looks Like in Your City

Market | Sites | Median visits/mo | Best site in market | Median search terms | Median DR |
Atlanta, GA | 2 | 8,300 | 16,375 | 1,149 | 18.1 |
Chicago, IL | 2 | 5,511 | 10,885 | 408 | 17.6 |
Raleigh, NC | 2 | 5,480 | 10,812 | 666 | 21.0 |
Denver, CO | 3 | 3,426 | 22,187 | 380 | 20.0 |
Los Angeles, CA | 3 | 2,654 | 3,411 | 373 | 25.0 |
San Diego, CA | 3 | 2,118 | 4,472 | 573 | 15.0 |
Kansas City, MO | 3 | 1,664 | 1,927 | 205 | 18.0 |
Newport Beach, CA | 3 | 1,629 | 3,212 | 195 | 25.0 |
Boston, MA | 2 | 1,255 | 2,498 | 172 | 4.0 |
Orlando, FL | 3 | 1,120 | 4,836 | 148 | 11.0 |
New York City, NY | 3 | 1,042 | 16,748 | 40 | 4.0 |
Columbus, OH | 3 | 853 | 5,109 | 122 | 19.0 |
Dallas, TX | 3 | 775 | 777 | 122 | 22.0 |
Salt Lake City, UT | 2 | 756 | 1,050 | 146 | 5.3 |
Miami, FL | 3 | 619 | 840 | 28 | 0.5 |
San Antonio, TX | 3 | 543 | 2,422 | 71 | 3.8 |
Austin, TX | 3 | 533 | 554 | 31 | 4.5 |
San Jose, CA | 3 | 473 | 558 | 60 | 6.0 |
Houston, TX | 3 | 461 | 782 | 52 | 2.0 |
New Orleans, LA | 3 | 438 | 1,281 | 130 | 2.4 |
Minneapolis, MN | 3 | 408 | 1,053 | 119 | 11.0 |
Nashville, TN | 3 | 386 | 1,733 | 31 | 5.0 |
Portland, OR | 3 | 348 | 823 | 78 | 7.0 |
San Francisco, CA | 3 | 329 | 595 | 29 | 16.0 |
Phoenix, AZ | 3 | 311 | 832 | 31 | 9.0 |
Cleveland, OH | 3 | 286 | 338 | 55 | 3.4 |
Scottsdale, AZ | 3 | 229 | 1,768 | 11 | 9.0 |
Tampa, FL | 3 | 148 | 1,063 | 34 | 0.7 |
Washington DC, DC | 3 | 145 | 318 | 40 | 11.0 |
Detroit, MI | 3 | 100 | 110 | 25 | 7.0 |
Fort Lauderdale, FL | 3 | 93 | 1,715 | 25 | 9.0 |
Philadelphia, PA | 3 | 70 | 713 | 19 | 2.0 |
Seattle, WA | 3 | 50 | 787 | 8 | 4.7 |
Las Vegas, NV | 3 | 31 | 281 | 5 | 0.9 |
Charlotte, NC | 2 | 8 | 17 | 6 | 6.1 |
Every market in the study. Multi-city chains excluded.
The typical top-ranked medspa in Atlanta gets 7,134 visits a month. In Las Vegas, 31. These are not different levels of business competence; they are different levels of search demand and different levels of local competition, and comparing yourself across them is meaningless.
Find your city. That number, not some agency's national benchmark, is what a good month looks like for you.
In Most Cities, One Medspa Takes Three-Quarters of Everything


Market | Leader's share of city traffic | Gap between best and worst of the three |
Charlotte | 100% | 17x |
Boston | 100% | 208x |
Chicago | 99% | 79x |
Raleigh | 99% | 74x |
Atlanta | 99% | 72x |
New York City | 94% | 598x |
Seattle | 93% | 157x |
Fort Lauderdale | 91% | 26x |
Las Vegas | 90% | 281x |
Philadelphia | 88% | 30x |
Tampa | 87% | 177x |
Denver | 85% | 41x |
San Antonio | 81% | 346x |
Scottsdale | 81% | 10x |
Columbus | 80% | 13x |
Nashville | 78% | 18x |
Orlando | 78% | 17x |
New Orleans | 75% | 1,281x |
Phoenix | 72% | 55x |
Minneapolis | 72% | 132x |
The twenty most concentrated markets in the study.
In the median city, the leading medspa holds 74.5% of the organic traffic going to the three businesses on that page. In eighteen of 35 cities it is above 70%.

Traffic gap between the best and worst of a city's three top-ranked medspas. Log scale.
The median gap between the strongest and weakest of the three businesses sitting on the same page of Google is 55x. They appear to be peers. They are not remotely peers.
Part 2: The Backlink Number in Your Report Means Nothing
Every medspa SEO report opens with a backlink count. In this category it is the least useful number in the whole dataset. Here is why.
Winners and Losers Have Almost the Same Number of Links

Quartile | All linking sites | Links passing authority | Share that count | Total backlinks |
Quietest 25% | 460 | 71 | 15% | 906 |
Second 25% | 494 | 88 | 18% | 990 |
Third 25% | 536 | 112 | 21% | 1,229 |
Busiest 25% | 690 | 202 | 29% | 2,221 |
Link profile by traffic quartile.
The quietest quarter of medspas - median thirteen visits a month, carry 462 linking websites. The busiest quarter carry 731. That is a 1.6x difference in links across a 238x difference in traffic.
The grey bars are what your agency reports. The orange bars are the part Google counts.
4 Out of 5 of Your Links Do Nothing

The median medspa in this study has 19% of its link profile passing authority. The other 81% is directory listings, scraper sites, social profiles and aggregators that carry a nofollow attribute - a piece of markup that tells Google to ignore the link entirely.
This is not your fault. Spa directories and booking aggregators scrape and link every medspa in America automatically. Every business in this study got roughly 400 backlinks for free, without asking. That is why the number rises on its own and tells you nothing.
51 Medspas Have Hundreds of Links and No Visitors

Half the field sits in the orange zone. If somebody is charging you a monthly fee and showing you a rising referring-domain count as evidence it is working, that chart is the answer. The count rises on its own.
The Links That Count, and How Many You Need

Authority-passing links | Sites | Median visits/mo | Median search terms |
Under 50 | 7 | 12 | 1 |
50–100 | 45 | 148 | 26 |
100–200 | 33 | 775 | 80 |
200–400 | 12 | 4,790 | 648 |
400+ | 4 | 5,248 | 546 |
Traffic by authority-passing referring domains.
Strip out the noise and a signal does appear. Below 100 authority-passing links, essentially nothing happens: 12 visits a month, then 148. Past 200, it moves sharply - 4,791.
So links are not worthless in this category. They are just badly measured. The useful number is authority-passing referring domains, it is available in every tool, and almost nobody reports it because the big number looks better.
You Need Less Authority Than You Think
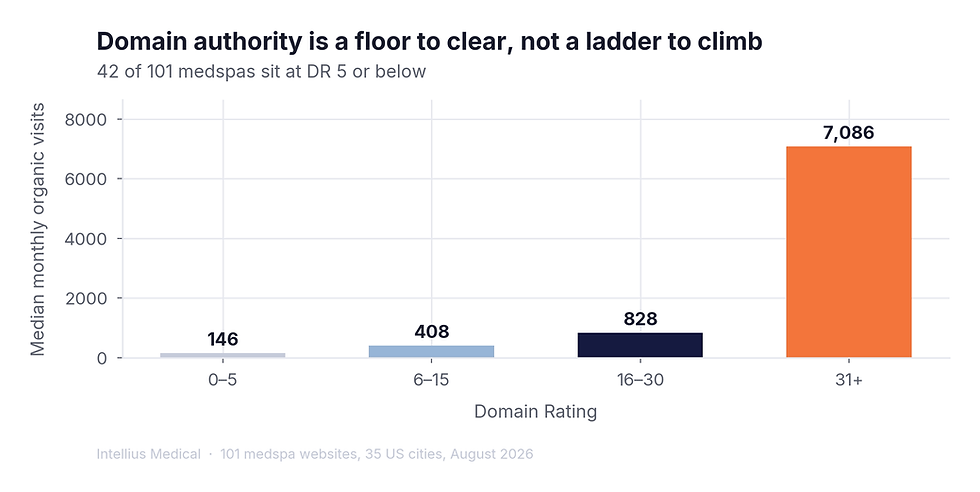
Domain Rating | Sites | Median visits/mo | Median search terms |
0–5 | 42 | 146 | 20 |
6–15 | 28 | 408 | 57 |
16–30 | 20 | 828 | 122 |
31+ | 11 | 7,086 | 621 |
Traffic by Domain Rating band.
Forty-two of 101 leading medspas sit at Domain Rating 5 or below. The jump that matters is from the 16–30 band to 31+, and above that the returns flatten.

Oviedo Med Spa in Orlando gets 4,836 visits a month on a Domain Rating of 0.9. That single data point should end any conversation in which somebody tells you that you need to build authority before you can publish.
Part 3: Being #1 on Google Is Not the Prize
This is the section that changed how we think about this category, and it started with a chart we built expecting to be boring.
The Medspa Ranked #1 Gets the Fewest Visitors
Every business in this study holds position one, two or three for med spa {city}. We split them by position and took the median traffic of each group, expecting a clean descending staircase.
![Median monthly organic visits by position in the 'med spa [city]' search results.](https://static.wixstatic.com/media/49c471_8dad481ab7464155b0f0d8672ebcc73f~mv2.png/v1/fill/w_980,h_439,al_c,q_90,usm_0.66_1.00_0.01,enc_avif,quality_auto/49c471_8dad481ab7464155b0f0d8672ebcc73f~mv2.png)
It runs backwards. The #1 results get a median of 318 visits a month. The #3 results get 713, more than double.
That is not a rounding artefact and it is not a small sample. It is 35 cities and 105 businesses. The single ranking that every medspa owner in America asks their agency about is negatively associated with actually getting found.
Because It Only Shows Up for One Search

The three organic positions compared on every metric.
There is the mechanism. The businesses holding #1 rank for a median of 31 search terms. The businesses at #3 rank for 78.
Something is sitting at the top of these results that is very good at winning one specific query and does nothing else at all. We went looking for it.
A Warning About the Bottom of This Data
Before we go further, something we got wrong and had to fix.
Twelve websites in this study share a naming pattern medspaof{city}.com and Ahrefs reports almost all of them at near-zero traffic while they hold top-three positions. Our first read was that these were empty sites gaming an exact-match domain.
That read was wrong. Two of them we were able to check against real analytics, and the actual numbers run into the thousands of organic visits a month against an Ahrefs figure in the hundreds or lower. These are working medspas with working websites.
A traffic tool reporting zero does not mean zero visitors. It means the tool cannot see them.
Ahrefs estimates traffic by matching a site's rankings against its own keyword database. Newer sites, smaller sites, and sites ranking for long-tail phrases the database does not track get badly undercounted, and the effect is worst exactly where our lowest numbers are.
So read the bottom of this study carefully. The comparisons hold a site estimated at 16,000 really is far ahead of one estimated at 400. The absolute numbers at the low end do not. A reported 4 visits a month is not evidence that a business is invisible. It is evidence that a third-party tool cannot measure it.
Everything in Parts 6, 7, 9 and 11 comes from data we collected ourselves: every page these websites publish, the pages themselves, and 125 reviews read by hand. None of it depends on a traffic estimate.
Part 4: Who Is Winning, and Why

Business | Market | Visits/mo | Search terms | Top-3 terms | Domain Rating | Pages |
Novuskin | Denver | 22,187 | 4,557 | 2,227 | 26 | 1,256 |
Tribeca MedSpa | New York City | 16,748 | 1,593 | 559 | 36 | 572 |
ELLEMES Medical Spa | Atlanta | 16,375 | 2,278 | 516 | 35 | 751 |
SpaDerma | Chicago | 10,885 | 813 | 213 | 35 | 486 |
Blue Water Spa | Raleigh | 10,812 | 1,308 | 535 | 33 | 0 |
VIO Med Spa Chicago | Chicago | 7,134 | 470 | 168 | 47 | 489 |
Elase Med Spa | Salt Lake City | 7,086 | 882 | 255 | 41 | 1,433 |
Boss Gal Beauty Bar | Columbus | 5,109 | 596 | 277 | 21 | 520 |
Oviedo Med Spa | Orlando | 4,836 | 390 | 126 | 1 | 223 |
Laser Clinique | San Diego | 4,472 | 700 | 232 | 30 | 658 |
Rejuvenate! Medical Spa | Denver | 3,426 | 380 | 98 | 20 | 0 |
Beverly Hills Med Spa | Los Angeles | 3,411 | 621 | 158 | 31 | 462 |

19 Medspas Are One Content Push From Winning Their City

Market | Authority-passing links | Search terms ranked | Visits/mo | |
Practice 1 | San Francisco | 248 | 86 | 595 |
Practice 2 | Seattle | 216 | 2 | 5 |
Practice 3 | Scottsdale | 184 | 6 | 183 |
Practice 4 | San Jose | 175 | 60 | 473 |
Practice 5 | Houston | 174 | 52 | 461 |
Practice 6 | Kansas City | 168 | 34 | 576 |
Practice 7 | Portland | 162 | 78 | 823 |
Practice 8 | Los Angeles | 159 | 3 | 24 |
Practice 9 | Cleveland | 153 | 55 | 338 |
Practice 10 | Washington DC | 147 | 40 | 145 |
Practice 11 | Scottsdale | 141 | 11 | 229 |
Practice 12 | Austin | 129 | 31 | 533 |
Practice 13 | Phoenix | 124 | 80 | 311 |
Practice 14 | Dallas | 121 | 3 | 4 |
Practice 15 | Houston | 121 | 78 | 782 |
Practice 16 | Las Vegas | 116 | 5 | 31 |
Practice 17 | San Antonio | 112 | 71 | 543 |
Practice 18 | Cleveland | 108 | 55 | 145 |
Practice 19 | Seattle | 101 | 72 | 787 |
All nineteen coverage-debt sites, anonymised to market level.
Nineteen businesses in this study carry 100 or more authority-passing referring domains and rank for fewer than 100 search terms. They have already done the hard part, earned real links, and have nothing published for those links to lift.
We have anonymised this list to city level. If your numbers look like these, you are the best-positioned business in this entire study: the expensive part is behind you and the cheap part is undone.
Your Website Platform Is Not the Problem

Platform | Sites | Median visits/mo | Median pages published |
Wordpress | 65 | 554 | 247 |
Webflow | 3 | 461 | 0 |
Squarespace | 7 | 438 | 142 |
Other | 18 | 324 | 72 |
Shopify | 3 | 281 | 53 |
Wix | 5 | 90 | 69 |
Traffic and page count by platform.
Two out of three of these medspas run WordPress. But every platform in the study has both leaders and laggards sitting on it, and the medspas we work with include a Wix site pulling several thousand visits a month. Whatever separates a busy medspa website from a quiet one, it is not the builder.
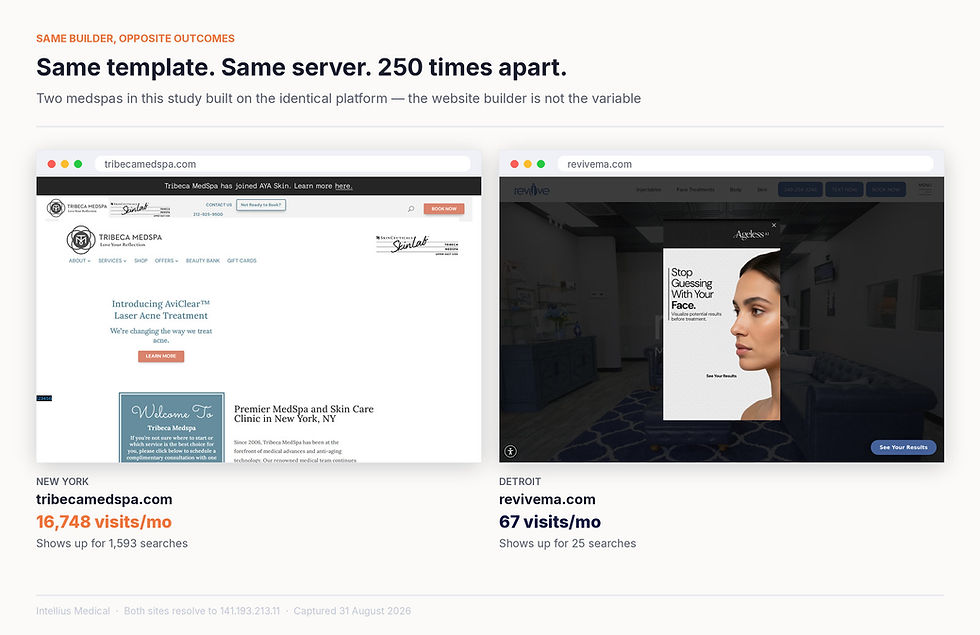
Ten of the 101 websites in this study are hosted on two adjacent IP addresses, built by the same vendor on the same template. Their traffic runs from 67 visits a month to 16,748. Whatever separates a leading medspa from an invisible one, it is not the platform, the template or the builder.
Almost No Medspa Runs Google Ads

Eight of 101, with a combined monthly spend of $390 across the entire field. Whatever paid acquisition medspas are doing, it is happening on Meta and TikTok, not on Google. The paid search channel in local medspa is, at the level we can observe, close to empty.
Part 5: What Belongs on Your Homepage
We measured sixteen things a medspa can put on its homepage and tested each against traffic. This is the summary chart, and it is the one to screenshot.

Financing Is the Single Best Thing to Add

Medspas whose homepage mentions financing - Cherry, Affirm, CareCredit, a payment plan of any kind - get 4.0x the traffic of those that do not. It is the strongest and statistically cleanest result we found (p = 0.0009). And 48% of the field never mentions it.
The reason is demand-side. Nobody searches botox once. They search botox, then botox cost, then botox payment plan near me, then is botox worth it. The financing question is a whole family of searches with real volume, and half the category has nothing on the page that could ever answer it.
Publishing Your Prices Does Nothing

What the homepage says about money | Sites | Median visits/mo |
Financing and a published price | 19 | 782 |
Financing only | 34 | 560 |
Published price only | 21 | 24 |
Neither | 27 | 286 |
Every combination of the two money signals.
This is the finding that most surprised us, because it directly contradicts our own earlier research.
In our study of 100 plastic surgery practices, homepages discussing cost got 3.7x the traffic, and 94% of leading practices published no price at all. It was the strongest content finding in that entire study.
In medspa, the same measurement returns 0.8x, p = 0.62. Statistically nothing. And the reason is right there in the prevalence figure: 40% of medspas already publish a real dollar price, against 6% of plastic surgeons.
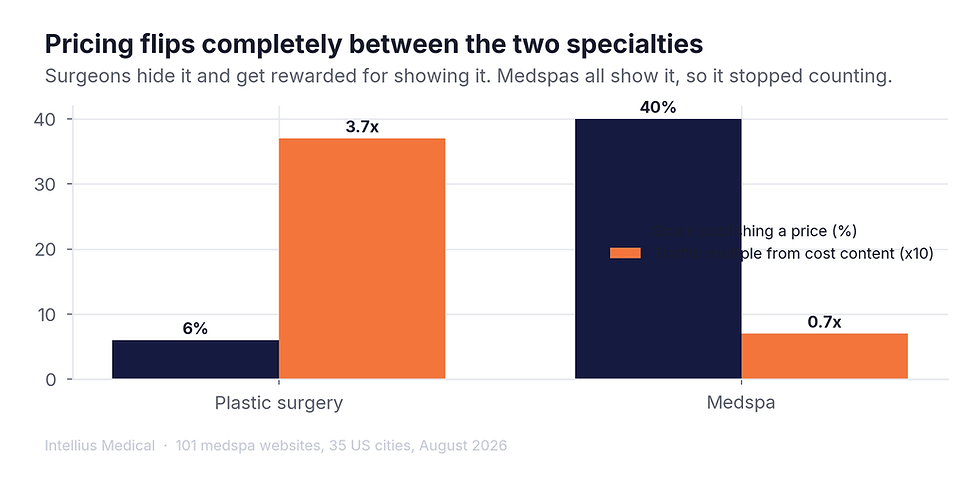
Price transparency is not a strategy in medspa. It is table stakes. Everybody does it, so it stopped being an advantage, which is exactly what happens to any tactic once a category adopts it. Financing is where medspa is now, and in three years that will be table stakes too.
An FAQ Section on Your Homepage Does Not Help

Medspas with an FAQ section get 0.4x the traffic of those without (p = 0.010). Question-style headings correlate negatively too, at −0.21.
This does not mean answering client questions is bad. It means six accordions above your footer is not answering client questions. The sites doing that in our sample did nothing else. Part 9 shows what the real version looks like.
The Code Your Agency Installs Does Nothing

Schema type | Sites with it | Median visits with | Median visits without | Multiple |
Physician | 6 | 2,194 | 386 | 5.7x |
Service | 11 | 1,050 | 397 | 2.6x |
AggregateRating | 15 | 777 | 334 | 2.3x |
MedicalBusiness | 17 | 619 | 367 | 1.7x |
Organization | 64 | 548 | 318 | 1.7x |
BreadcrumbList | 49 | 473 | 423 | 1.1x |
LocalBusiness | 27 | 408 | 462 | 0.9x |
FAQPage | 5 | 1,715 | 423 | 4.1x |
Every schema type present on three or more sites.
LocalBusiness schema - installed on 27 of these sites, and the first thing on every technical SEO checklist in this industry tracks with 0.9x. No advantage at all.
What does track: Physician schema at 5.7x (only six sites have it, so treat that as a lead rather than a law), Service at 2.6x, AggregateRating at 2.3x. The pattern across all three is that they describe who treats you, what they do and how well it went. The one that does nothing merely says this is a business with an address, which Google already knows.
What Almost Every Medspa Website Is Missing

Missing element | Share of leading medspas without it |
A comparison table anywhere on the homepage | 97% |
FAQPage schema markup | 95% |
Any FAQ content at all | 66% |
Real online booking software | 57% |
A before-and-after gallery | 53% |
Any mention of financing | 48% |
A blog | 44% |
Ninety-eight of 101 leading medspa websites contain no comparison table. Not one comparing Botox to Dysport, or Morpheus8 to Ultherapy, or their own packages against each other.
That matters more every month, because a comparison table is the single most extractable format on the web. It is what Google's AI Overview pulls from, what ChatGPT summarises, and what a patient deciding between two treatments actually needs. The entire category has left it empty.
The Full List: What Works and What Doesn't
Element | Traffic multiple | Verdict |
Offers financing | 4.0x | Strongest signal in the study (p = 0.0009) |
Names a medical provider by name | 3.1x | Real (p = 0.059) |
Before-and-after gallery | 2.9x | Real (p = 0.012) |
Says 'board certified' | 2.3x | Probably real (p = 0.095) |
Real booking software installed | 1.8x | Real (p = 0.020) |
Links to a blog | 1.9x | Probably real (p = 0.082) |
Reviews shown on the homepage | 1.7x | Not significant |
A 'Book Now' button | 1.3x | Not significant |
Chat or SMS widget | 1.1x | No effect |
Membership programme | 0.9x | No effect |
Publishes a real price | 0.8x | No effect |
Has an FAQ section | 0.4x | Runs the wrong way (p = 0.010) |

What we measured on the homepage | Correlation with traffic | p-value | Significant? |
Links from homepage into the site | +0.52 | <0.0001 | Yes |
Treatments named on homepage | +0.49 | <0.0001 | Yes |
Total pages published | +0.43 | <0.0001 | Yes |
Title tag length | +0.38 | <0.0001 | Yes |
Homepage word count | +0.35 | 0.0003 | Yes |
Images on homepage | +0.31 | 0.0015 | Yes |
Blog pages published | +0.26 | 0.0100 | Yes |
Schema types installed | +0.15 | 0.1305 | No |
Comparison tables | -0.05 | 0.5884 | No |
Question-style headings | -0.21 | 0.0313 | Yes |
Every crawl variable, tested against traffic.
Part 6: Why Some Medspas Show Up Everywhere and You Don't
Everything so far has been about what does not separate winners from losers. This part is about the one thing that does, and it is almost embarrassingly simple.
Every Search Is a Separate Race You Have to Enter
botox near me is one race. how much does morpheus8 cost in dallas is another. lip filler swelling day 3 is another. There are tens of thousands of them running in your city every month, and you can only place in a race you have entered.
Busy and Quiet Medspas Rank Equally Well

Quartile | Search terms ranked | Terms in top 3 | Top-3 rate | Terms in positions 4–10 |
Quietest 25% | 3 | 0 | 17% | 2 |
Second 25% | 34 | 11 | 32% | 21 |
Third 25% | 78 | 30 | 38% | 42 |
Busiest 25% | 380 | 158 | 42% | 243 |
Ranking quality and ranking quantity, side by side.
Once a medspa ranks for anything at all, it converts those rankings into top-three finishes at roughly the same rate as the market leader: 33%, 36%, 34%. The busiest sites are not better at ranking. They are not out-optimising anyone.
The Winners Just Show Up for 127x More Searches


Three terms against 470. That is the entire study in one chart. You do not have a ranking problem. You have an entry problem.
Here Is Exactly What Each Extra Search Is Worth

Search terms you rank for | Median monthly visits | What that is worth in ads |
0–10 | 8 | $25 |
11–50 | 228 | $403 |
51–200 | 556 | $1,046 |
201–500 | 1,927 | $2,329 |
501–1,000 | 4,791 | $7,569 |
1,000+ | 16,562 | $22,071 |
Every band beats the one below it. No exceptions.

Quartile | Total pages | Blog pages | Service pages | Location pages |
Quietest 25% | 97 | 1 | 1 | 0 |
Second 25% | 137 | 1 | 1 | 0 |
Third 25% | 225 | 1 | 2 | 0 |
Busiest 25% | 489 | 3 | 3 | 0 |
What the leaders are actually publishing, by page type.
We looked for a counter-example: a medspa ranking for very little and getting a lot of traffic anyway, and there isn't one. Not one site in 101.
Half of These Medspas Show Up for Fewer Than 52 Searches
That is the median for the group. Fifty-two search terms, in a category where a serious operator can reasonably compete for several thousand. The room in this market is enormous and almost nobody is standing in it.
More Pages Works, But Only After You Pass 300

Total pages published | Sites | Median visits/mo | Median search terms |
Under 50 | 20 | 296 | 30 |
50–150 | 28 | 162 | 27 |
150–300 | 17 | 145 | 26 |
300–600 | 20 | 936 | 126 |
600–1,200 | 10 | 958 | 208 |
1,200+ | 6 | 2,438 | 285 |
Traffic by total pages published.
Read that carefully, because it is the most practically useful chart in this study.
Sites with under 50 pages get 296 visits a month. Sites with 50 to 300 pages get less 162, then 145. Only past 300 pages does it start paying: 937, then 958, then 2,438.
That dip is real and we found the same shape in plastic surgery. It has a name in the wild: it is the four-blog-posts-a-month retainer. Two hundred pages is enough to look like a content programme in a monthly report and not nearly enough to cover a market. A medspa in that band has usually spent $30,000 to $50,000 getting there.
To lead a competitive medspa market, plan for 400 to 1,000 pages. Not 200.
The 30-Second Test for Whether Your Content Is Working

Quartile | Median pages | Median visits/mo | Visits per page per month |
Quietest 25% | 97 | 14 | 0.12 |
Second 25% | 137 | 266 | 1.32 |
Third 25% | 225 | 775 | 2.82 |
Busiest 25% | 489 | 3,212 | 7.38 |
The efficiency diagnostic, by quartile.
Divide your monthly organic visits by your number of pages. The quietest quarter earn 0.12 visits per page per month. The busiest earn 7.38. A 61x spread.
This is the single best diagnostic in the study, and you can calculate it in thirty seconds. If your site earns under one visit per page per month, publishing more of the same pages will not fix it. Something about what you are publishing is wrong, and volume will only make it more expensive to be wrong.

List 21+ Treatments and You Get 6x the Visitors

Treatments named on homepage | Sites | Median visits/mo | Median search terms |
Under 10 | 19 | 229 | 25 |
10–15 | 27 | 93 | 9 |
16–20 | 17 | 533 | 72 |
21–30 | 28 | 1,052 | 128 |
30+ | 10 | 1,364 | 182 |
Traffic by treatments named on the homepage.
Medspas naming 21 or more treatments get a median of 1,058 visits a month. Those naming twenty or fewer get 175.
Note the dip in the 10–15 band, which underperforms the under-10 band. We think that is a real pattern rather than noise: a site naming five treatments is usually a specialist doing one thing well, while a site naming twelve is usually a generalist doing none of them in depth.
We are counting anything a medspa markets as a distinct service, which includes injectables, devices, facials, IV therapy and weight loss. If you provide twelve treatments and market twelve, this finding does not mean invent more. It means each one needs a page that can rank on its own.